What do you know about Statistics? Name ________________________
- During one marking period John’s test grades were 88, 75, 90, and 79. What grade must John get on his fifth test to maintain an average of 85?
2. Find the mean, median and mode of the following data: 5, 5, 6, 7, 7. Make sure to label your answers.
3. Make a stem-and-leaf plot for this set of data on Notebook Prices.
5. Find the range of this set of data.
Below is the number of hours a student worked each week at her summer job. When she applied for the job, she was told the typical work wee was 29 hours. The following are the hours she has worked in the past 11 weeks:
29, 23, 21, 20, 17, 16, 15, 33, 33, 32, 15
6. Make a box and whisker plot for the data.7.
7. What is the median number of hours she worked?
8. What is the mean?
9. What is the range?
The frequency table below shows the distribution of time, in minutes, in which 40 students finished the 5K Firecracker Run.
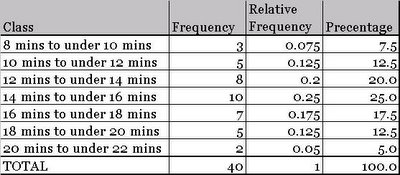
10. How many students finished the race in less than 23 minutes?
11. Based on the frequency table, which interval contains the median?
12. Complete the frequency table below.
13. Using the cumulative frequency table complete, construct a cumulative frequency histogram.